Time and Estimation
Article
I have been writing about cognitive styles in maths for many years. What I mean by that is the way we think through maths problems and tasks. The ‘Inchworm’ style is based on being precise, detailed and formulaic. The ‘Grasshopper’ style is more about taking an overview, seeing the big (or whole) picture, getting a ‘ball park’ sense of an answer, using flexible approaches. Estimation is a natural grasshopper skill.
Much about time fits into these two styles of thinking. For example, there are the ultimate inchworm creation, timetables. I perceive these as a mass of figures, of data, which I must scan in order to find the information I want. In the UK, the time for the arrival of a train is given precisely, for example, 10:43. We are pleased if that happens, but still pleased if it’s 10:45 or 10:50. I travelled to Japan and was so very impressed when the announcer at the train station said that the next train would be 20 seconds late. My perception of 20 seconds is that it is not ‘late’. As an American student of mine said about such things, ‘Close enough for Government work.’
If I took my younger daughter to a shopping mall and she said, ‘See your in an hour, Dad’, then I was well aware that this would be an underestimate. (Also practised by her Mum)
The point I am heading towards here, is that, for time in everyday life, ‘Close enough for Government work.’ Is close enough for much of everyday life. If I can persuade you of this, then we teachers may be able to use ‘time’ as a route towards understanding estimation, appraising an estimate and refining an estimate (‘More or less?’ ‘Bigger or smaller?’ are useful, low stress questions.)
There will be some spin-offs into other maths topics. Time uses ‘quarters’ and ‘halves’, counting down and counting on, and a circular number line.
The circular number line: A clock face
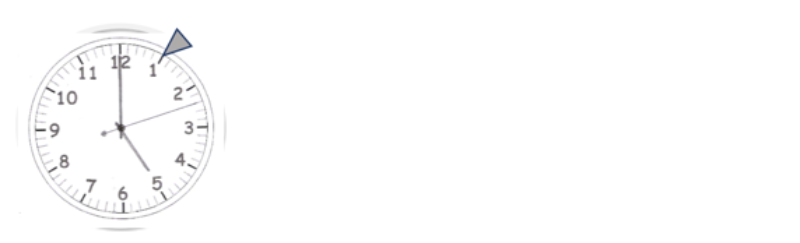
Measuring time is not like measuring the width of a room. The width of a room is a fixed one dimension and can be measured with a straight ruler. Measuring the time between 4pm today and 5pm tomorrow will involve the hour hand going one complete circuit of the clock face and then one more hour: one circuit = 12 hours. Then 1 more hour, 12 + 1 = 13 hours.
Although the clock’s circular, number line only covers 12 hours, you can and do, ‘go round again and again’ so here I show 1 or 13 (12 + 1) hours. If we went round a further 11 hours, we would be back at 12 again, having covered 2 x 12 = 24 hours
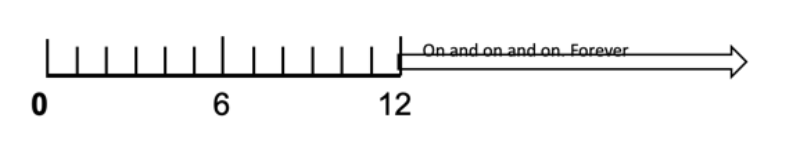
With the clock face you can go round for as many 12-hour cycles as you wish. Every 24 (2 x 12) hours, two cycles, represents another whole day.
With a straight number line, every extra distance you travel takes you further away from the start. The number line has to stretch out, effectively, forever. So a circular number line is a really good idea for representing time.
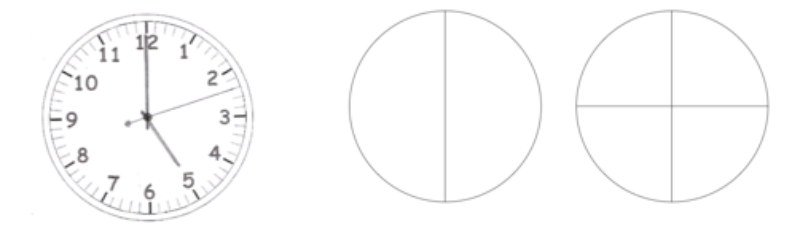
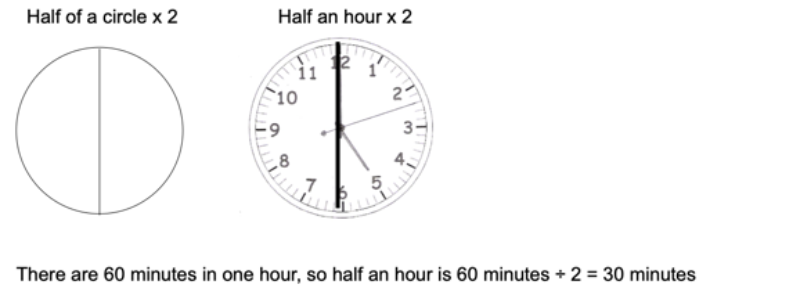
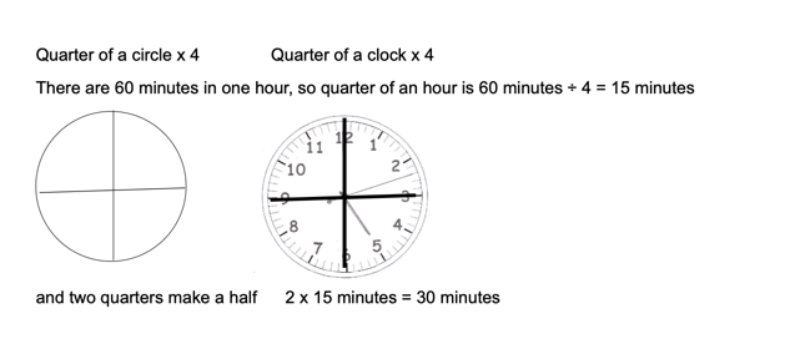
Using a circle to demonstrate basic value fractions should be familiar. We can use this visual to look at half and quarter hours:
So many topics in maths are interlinked. This can be a problem if the negative aspects are transferred, but a huge positive if we can encourage our students to see different facets of a topic from its different manifestations. Each perspective may add another layer of understanding of a topic.
For teachers it’s a case of WEAYT, ‘What Else Are You Teaching? ’For students it’s ‘WEAYL’ ‘What Else Are You Learning?’